Global Weather Analysis
The internet is a vast wealth of information and with a simple request to the OpenWeather API, I retrieved
weather statistics for over 600 cities and organized the data into a Pandas dataframe for analysis.
Using various visuazliations, linear regression, and plotting with Google Maps, the analysis herein offers
a glimpse of potential correlations in global weather statistics, as well as the power of Python for data analytics.
Latitude vs X
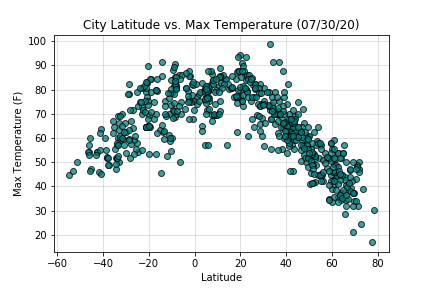
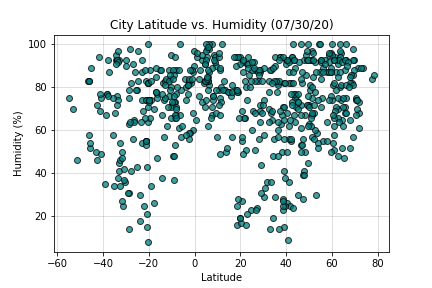
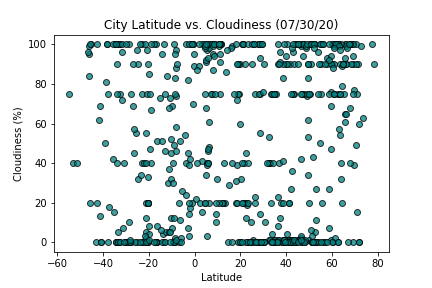
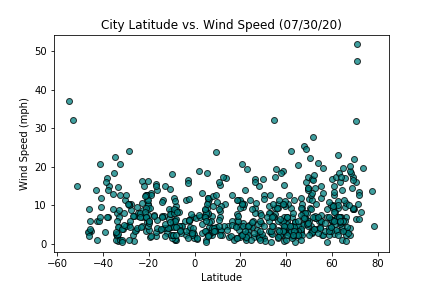
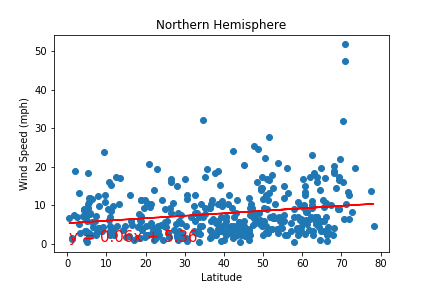
Using matplotlib, I organized scatterplots comparing a city's latitude to four different weather statistics: Max Temperature, Humidity %, Cloudiness %, and Wind Speed (MPH). Though no discernable, significant trends were observed for the latter three statistics, a clear trend appears when comparing Latitude to Max Temperature. Generally, a city's temperature tends to be higher the closer to the equator, or 0 Latitude, that it is.
Regression Analyses by Hemisphere
Northern Hemisphere
Southern Hemisphere
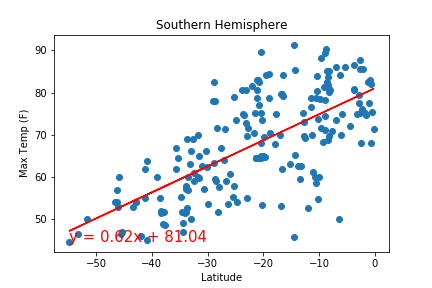
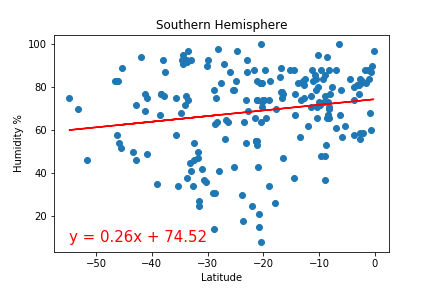
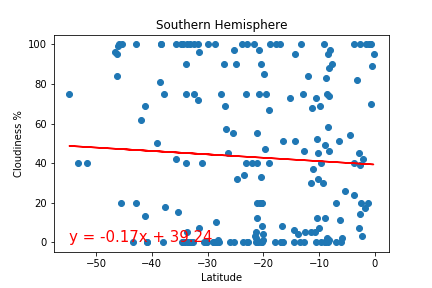
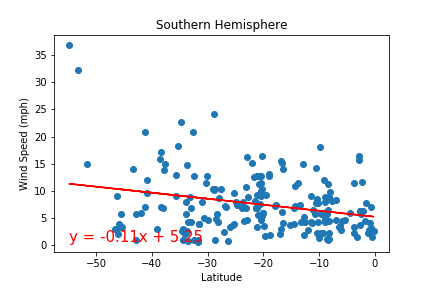
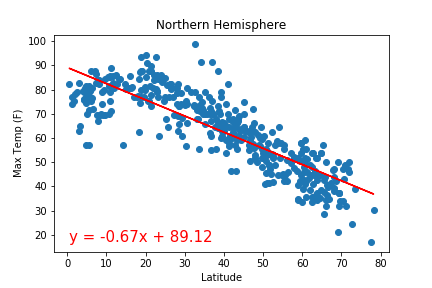
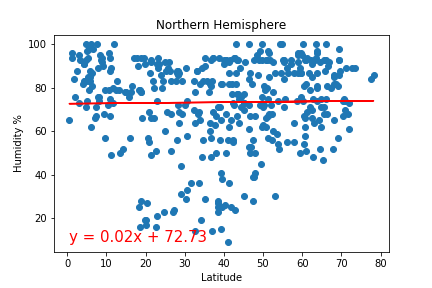
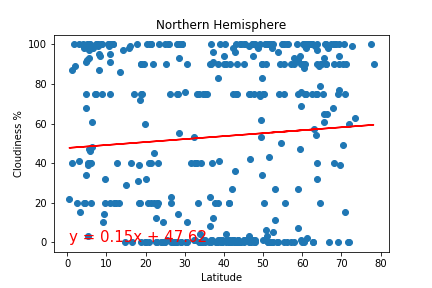
For further analysis, the cities were divided by their Latitudal Hemispheres; North and South. With the help of Scipy, the comparisons from each scatterplot were reanalyzed by hemisphere with a bespoke regression function and replotted along with their lines of best fit. Though the visualizations provide similar insights into the impact of Latitude on weather statistics as the previous scatterplots, the segmented perspective demonstrates the relative impact of trends on each hemisphere, and statistics ascertained from linear regression improve the quality of objective comparison. The prominent trend is again between Latitude and Max Temperature, but one may now more clearly see the disparate severity of the trend between hemispheres, with cities farther to the North following a tighter pattern of temperature relative to Latitude.
Gmaps Plotting
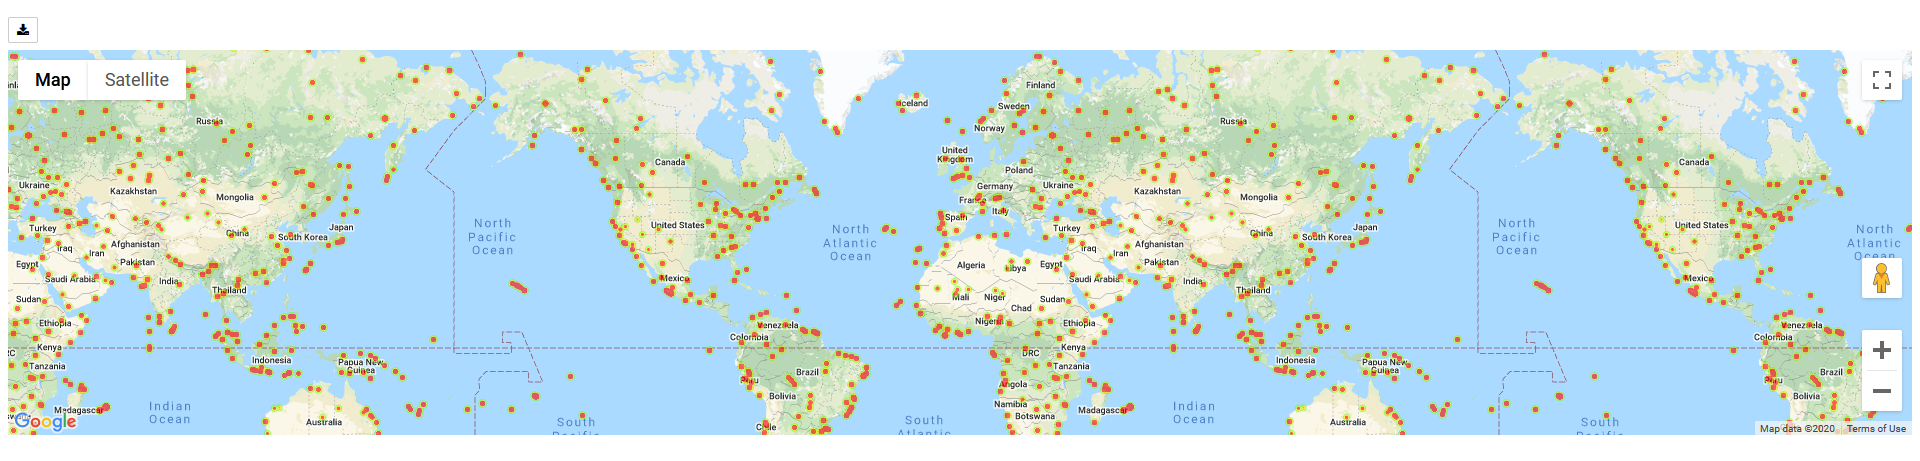
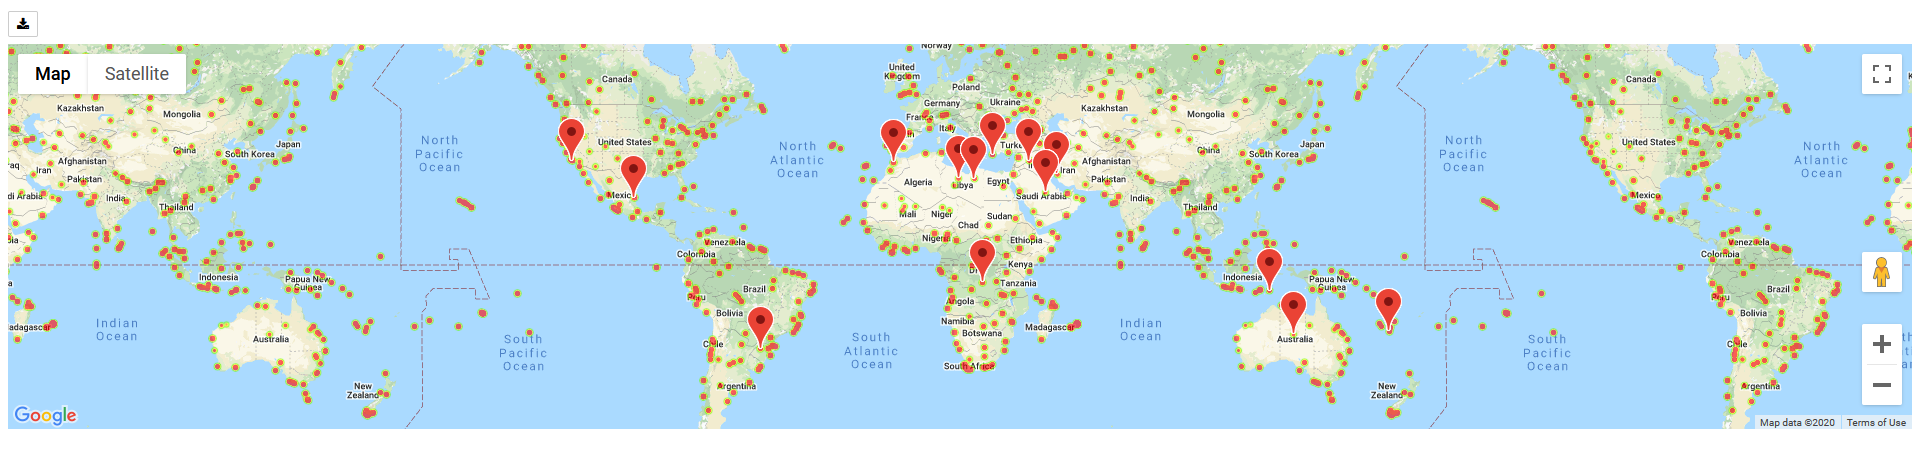
Finally, in the interest of facilitating end-user consumption of the data and providing an additional value-add for the analysis, the results were plotted using Google Maps. The first map (left) is a heatmap of the cities randomly selected from the OpenWeatherAPI, based on their Humidity %. The second map (right) is a combination of the weather statistics, and hotel information from the Google Maps API. It plots the location of several hotels across the world which, based on the above anlysis, are in favorable climates for one to enjoy a relaxing vacation. Please click either of the links found below the pictures to view interactive versions of the maps.