Automated Stocks Analysis
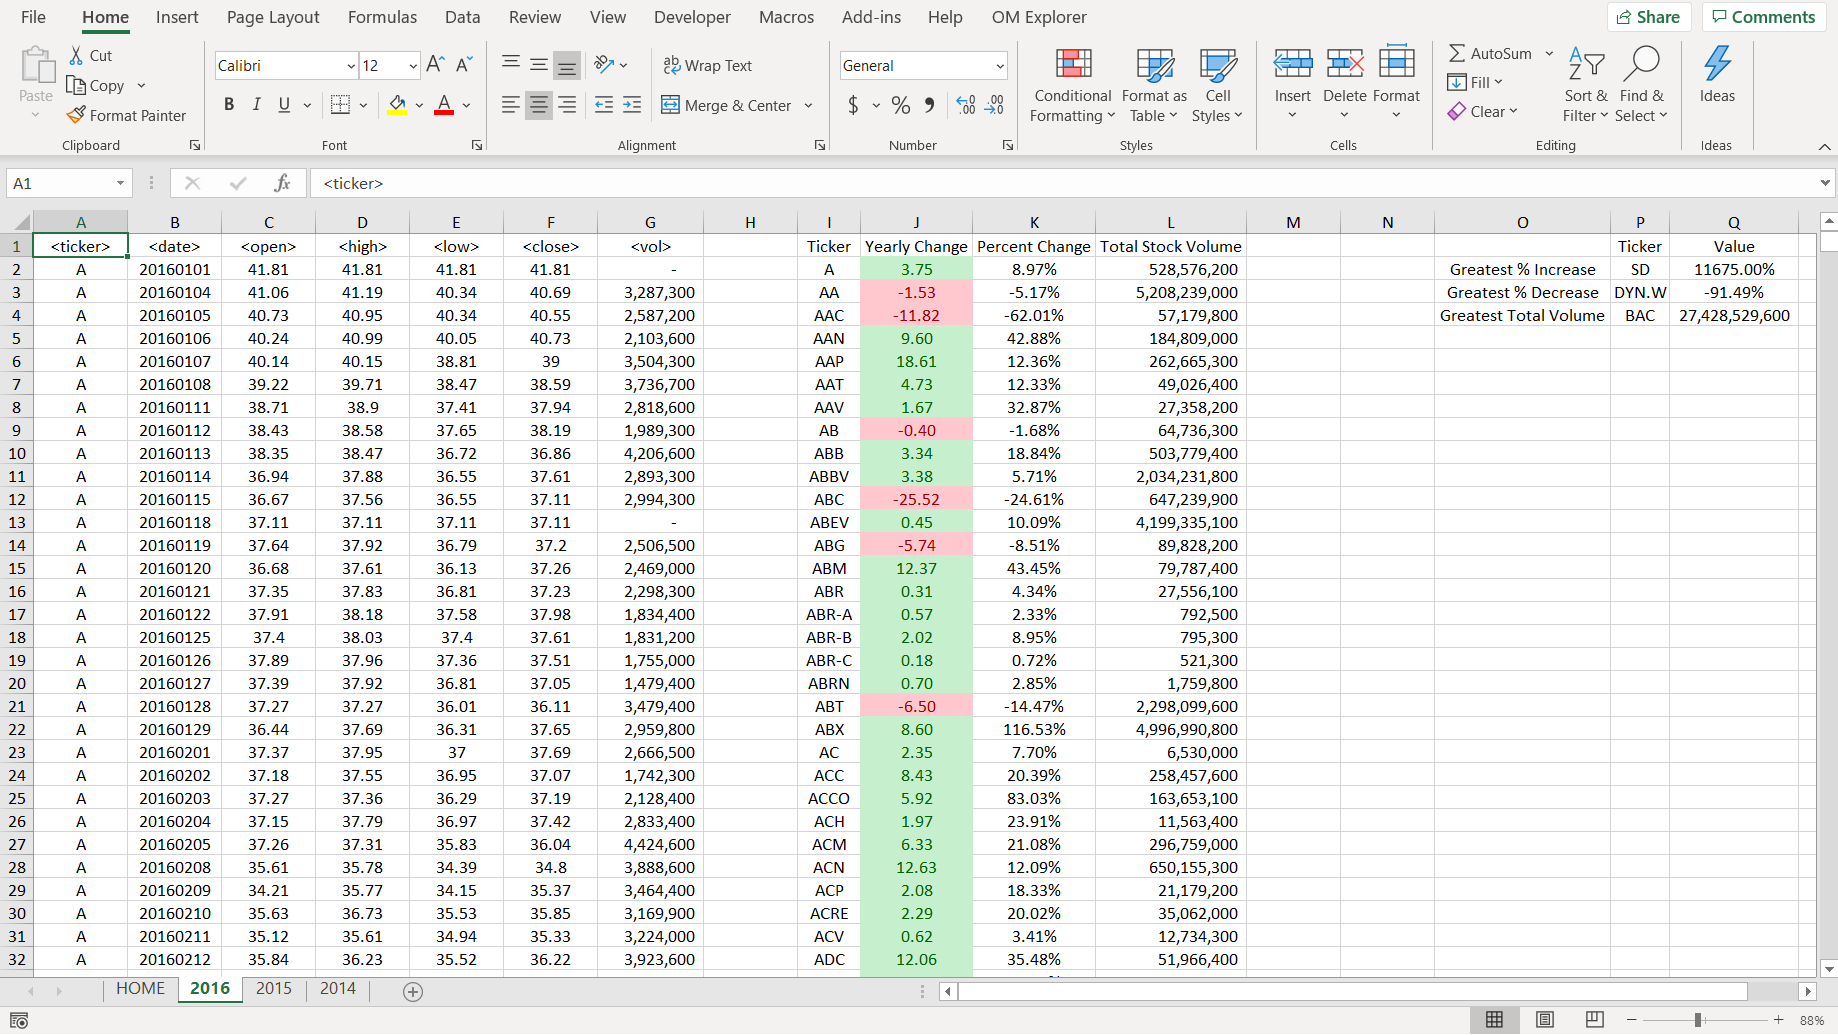
Utilizing VBA in Excel, I generated an automated analysis tool to navigate over 2 million stock values over a three year period.
For each individual stock, the tool automatically calculates:
- Yearly Change - Percent Change - Total Stock Volume
Additionally, it determines the stock(s) with the Highest % Increase, Highest % Decrease,
and Highest Total Volume.
Screenshots of the results are included below for each year analyzed.
The raw VBA code can
be found on my GitHub repo, linked above.
2014 Analysis

2015 Analysis

2016 Analysis